{"id":2100,"title":"Solution 2 - Japanese Tourism And Australian Share Of The Japanese Tourist Market","advertisement_flag":false,"content":"\n\u003cp\u003eThe charts below show the number of Japanese tourists travelling abroad between 1985 and 1995 and Australian share of the Japanese tourist market. \u003c/p\u003e\n\n\u003cp\u003eWrite a report for a university lecturer describing the\u003c/p\u003e\n\n\u003cp\u003einformation shown below.\u003c/p\u003e\n\n\u003cp\u003e• You should write at least 150 words. \u003c/p\u003e\n\n\u003cp\u003e• You should spend about 20 minutes on this task. \u003c/p\u003e\n\n\u003cp\u003e\u003ca href=\"/d/7-1-ielts-writing-task-1-japanese-tourism-and-australian-share-of-the-japanese-tourist-market\" rel=\"nofollow\"\u003eSolution 1\u003c/a\u003e\u003c/p\u003e\n\n\u003cp\u003e\u003ca href=\"/d/7-2-ielts-writing-task-1-japanese-tourism-and-australian-share-of-the-japanese-tourist-market\" rel=\"nofollow\"\u003eSolution 2\u003c/a\u003e\u003c/p\u003e\n","created_at":"2013-08-18T08:00:44.000Z","author_name":"Bob","tag_groups":["ielts-writing-part-1|IELTS Writing Part 1|false","ielts-writing-part-1-academic|IELTS Writing Part 1 Academic|false","ielts-writing-diagram-bar-chart|IELTS Writing Diagram Bar Chart|false","ielts-writing|IELTS Writing|false","ielts-writing-graphs|IELTS Writing Graphs|false","ielts-academic-writing|IELTS Academic Writing|false"],"author_id":1,"slug":"7-2-ielts-writing-task-1-japanese-tourism-and-australian-share-of-the-japanese-tourist-market","parent_id":null,"visits":6676,"likes":2,"image":"/rails/active_storage/representations/eyJfcmFpbHMiOnsibWVzc2FnZSI6IkJBaHBBajRDIiwiZXhwIjpudWxsLCJwdXIiOiJibG9iX2lkIn19--71c615a820d146f73525d351af793bf0c835bb2f/eyJfcmFpbHMiOnsibWVzc2FnZSI6IkJBaDdCam9MY21WemFYcGxTU0lOTVRFd01IZzJNakVHT2daRlZBPT0iLCJleHAiOm51bGwsInB1ciI6InZhcmlhdGlvbiJ9fQ==--03073c48c81b618581157c4a4bd8e0bb47be452b/IELTS-Writing-Task-1-Japanese-Tourism-And-Australian-Share-Of-The-Japanese-Tourist-Market_1.jpg"}
[{"id":2101,"title":null,"advertisement_flag":false,"author_id":1,"content":"\n\u003cp\u003eThe bar graph illustrates the number in millions of Japanese travelling overseas over a period of 10 years between 1985 and 1995 , while the line graph gives information about the proportion of Australians toward Japanese' tourist market. \u003c/p\u003e\n\n\u003cp\u003eOverall , The first graph shows the Japanese tourists who increased in number over a decade , whereas the second graph also showed an upward trend in the distribution of Australian in Japanese travelers. \u003c/p\u003e\n\n\u003cp\u003eOn the first chart, just above 4 million of Japanese traveled in other country in 1985 and rose to nearly above 11 million after 5 years. Then it slightly declined into million in 1991 , after a year it increased by 2 million in 1992 and remained steady for 2 years , lastly the Japanese tourist suddenly grew in number and hit the highest point at about million in 1995. \u003c/p\u003e\n\n\u003cp\u003eFor the line chart , the percentage of the distribution of Australian into Japan's market increased steadily and stood at almost 5 % after 4 years beginning at 1985 , then gently plummeted after a year by 1%. From 1989 up to 1993 , It significantly rose again and peaked at year in 1993 at about 6.2% of Australian's share, it gradually decreased minimally at 6% 2 years later.\u003c/p\u003e\n","created_at":"2013-08-18T08:00:44.000Z","author_name":"marjloveselmo","tag_groups":[],"slug":null,"parent_id":2100,"visits":0,"likes":-1,"image":"/rails/active_storage/representations/eyJfcmFpbHMiOnsibWVzc2FnZSI6IkJBaHBBajhDIiwiZXhwIjpudWxsLCJwdXIiOiJibG9iX2lkIn19--50d655d189ecb257a772a38b699afef46f275721/eyJfcmFpbHMiOnsibWVzc2FnZSI6IkJBaDdCam9MY21WemFYcGxTU0lOTVRFd01IZzJNakVHT2daRlZBPT0iLCJleHAiOm51bGwsInB1ciI6InZhcmlhdGlvbiJ9fQ==--03073c48c81b618581157c4a4bd8e0bb47be452b/IELTS-Writing-Task-1-Japanese-Tourism-And-Australian-Share-Of-The-Japanese-Tourist-Market_1.jpg"},{"id":2102,"title":null,"advertisement_flag":false,"author_id":1,"content":"\n\u003cp\u003eWriting Tips:\u003c/p\u003e\n\n\u003cp\u003e\u003ca href=\"/d/how-can-i-improve-my-writing-skills\" rel=\"nofollow\"\u003eHow To Improve Writing Skills\u003c/a\u003e\u003c/p\u003e\n\n\u003cp\u003e\u003ca href=\"/d/what-required-ielts-writing\" rel=\"nofollow\"\u003eWhat Is Required In IELTS Writing\u003c/a\u003e\u003c/p\u003e\n\n\u003cp\u003e\u003ca href=\"/d/tips-ielts-vocabulary-writing\" rel=\"nofollow\"\u003eTips On IELTS Vocabulary For Writing\u003c/a\u003e\u003c/p\u003e\n\n\u003cp\u003e\u003ca href=\"/d/how-your-ielts-essays-are-graded\" rel=\"nofollow\"\u003eHow Your IELTS Essays Are Graded\u003c/a\u003e\u003c/p\u003e\n","created_at":"2013-08-18T09:57:56.000Z","author_name":"Bob","tag_groups":[],"slug":null,"parent_id":2100,"visits":0,"likes":-1,"image":"/rails/active_storage/representations/eyJfcmFpbHMiOnsibWVzc2FnZSI6IkJBaHBBa0FDIiwiZXhwIjpudWxsLCJwdXIiOiJibG9iX2lkIn19--98d7ffc86f3a68c2b5f738e7408f37c7aab8c3ee/eyJfcmFpbHMiOnsibWVzc2FnZSI6IkJBaDdCam9MY21WemFYcGxTU0lOTVRFd01IZzJNakVHT2daRlZBPT0iLCJleHAiOm51bGwsInB1ciI6InZhcmlhdGlvbiJ9fQ==--03073c48c81b618581157c4a4bd8e0bb47be452b/IELTS-Writing-Task-1-Japanese-Tourism-And-Australian-Share-Of-The-Japanese-Tourist-Market_1.jpg"}]
[{"id":3034,"name":"Solution 1 - The Rise In Popularity Of The Internet","short_content":"With the rise in popularity of the Internet, newspapers will soon become a thing of the past. To what extent do you agree or disagree?\n\nSolution 1\n ...","likes":2,"slug":"199-1-ielts-writing-with-the-rise-popularity-internet","tag_groups":["ielts-writing-part-2|IELTS Writing Part 2|false","ielts-writing-agree-or-disagree|IELTS Writing Agree Or Disagree|false","ielts-writing|IELTS Writing|false","ielts-academic-writing|IELTS Academic Writing|false"],"image":null},{"id":967,"name":"Speaking Partner - mahsan m","short_content":"Aim:\n\ni wanna to improve my english speaking for ielts test\n\nmy predicted score is around 6\n\nAvailability:\n\n17-22\n\nOnline:\n\nYAHOO: mahsabsb66@yahoo.com ...","likes":1,"slug":"speaking-partner-mahsan-m","tag_groups":["english-skills-speaking-partner|English Skills - Speaking Partner|false","ielts-academic-writing|IELTS Academic Writing|false"],"image":null},{"id":968,"name":"Speaking Partner - Anish Pusasaini","short_content":"Aim:\n\nI want to practise my speaking so that i can increase fluency and pronunciation. Thats all join me please\n\nAvailability:\n\n12 pm to 3pm sydney ...","likes":5,"slug":"speaking-partner-anish-pusasaini","tag_groups":["english-skills-speaking-partner|English Skills - Speaking Partner|false","ielts-academic-writing|IELTS Academic Writing|false"],"image":null},{"id":3037,"name":"Solution 1 - Practical Subjects Vs Theoretical Subjects","short_content":"Many people choose to learn practical subjects therefore theoretical subjects will be no longer be taught in universities. Do you agree or disagree?.\n\n ...","likes":7,"slug":"200-1-ielts-writing-many-people-choose-learn-practical-subjects-theoretical","tag_groups":["ielts-writing-part-2|IELTS Writing Part 2|false","ielts-writing-agree-or-disagree|IELTS Writing Agree Or Disagree|false","ielts-writing|IELTS Writing|false","ielts-academic-writing|IELTS Academic Writing|false"],"image":null},{"id":3040,"name":"Solution 1 - Animal Experiments","short_content":"Examine the arguments in favor and against animal experiments and come to a conclusion in this issue.\n\nSolution 1\n ...","likes":2,"slug":"201-1-ielts-writing-examine-arguments-favor-against-animal-experiment","tag_groups":["ielts-writing-part-2|IELTS Writing Part 2|false","ielts-writing-opinion|IELTS Writing Opinion|false","ielts-writing|IELTS Writing|false","ielts-academic-writing|IELTS Academic Writing|false"],"image":null}]
main-forum
[{"id":70,"slug":"english-skills-listening","name":"English Skills - Listening","post_name":"News For English Skills - Listening"},{"id":72,"slug":"tips-learning-english","name":"Tips For Learning English","post_name":"News For Learning English"},{"id":73,"slug":"english-common-questions","name":"English Common Questions","post_name":"News For English Common Questions"},{"id":75,"slug":"ielts-speaking-part-1-samples","name":"IELTS Speaking Part 1 Samples","post_name":"News For IELTS Speaking Part 1 Samples"},{"id":76,"slug":"ielts-speaking-part-2-3-samples","name":"IELTS Speaking Part 2 \u0026 3 Samples","post_name":"News For IELTS Speaking Part 2 \u0026 3 Samples"},{"id":77,"slug":"ielts-speaking-samples-and-answers","name":"IELTS Speaking Samples And Answers","post_name":"News For IELTS Speaking Samples And Answers"},{"id":68,"slug":"ielts-listening-part-1","name":"IELTS Listening Part 1","post_name":"News For IELTS Listening Part 1"},{"id":74,"slug":"ielts-speaking-samples","name":"IELTS Speaking Samples","post_name":"News For IELTS Speaking Samples"},{"id":78,"slug":"english-skills-speaking-partner","name":"English Skills - Speaking Partner","post_name":"News For English Skills - Speaking Partner"},{"id":81,"slug":"ielts-writing-part-1-general","name":"IELTS Writing Part 1 General","post_name":"News For IELTS Writing Part 1 General"},{"id":83,"slug":"ielts-writing-agree-or-disagree","name":"IELTS Writing Agree Or Disagree","post_name":"News For IELTS Writing Agree Or Disagree"},{"id":84,"slug":"ielts-writing-discuss-and-give-opinion","name":"IELTS Writing Discuss And Give Opinion","post_name":"News For IELTS Writing Discuss And Give Opinion"},{"id":85,"slug":"ielts-writing-opinion","name":"IELTS Writing Opinion","post_name":"News For IELTS Writing Opinion"},{"id":82,"slug":"ielts-writing-part-1-academic","name":"IELTS Writing Part 1 Academic","post_name":"News For IELTS Writing Part 1 Academic"},{"id":86,"slug":"ielts-writing-diagram-process","name":"IELTS Writing Diagram Process","post_name":"News For IELTS Writing Diagram Process"},{"id":87,"slug":"ielts-writing-diagram-map","name":"IELTS Writing Diagram Map","post_name":"News For IELTS Writing Diagram Map"},{"id":88,"slug":"ielts-writing-diagram-bar-chart","name":"IELTS Writing Diagram Bar Chart","post_name":"News For IELTS Writing Diagram Bar Chart"},{"id":89,"slug":"ielts-writing-advantages-disadvantages","name":"IELTS Writing Advantages Disadvantages","post_name":"News For IELTS Writing Advantages Disadvantages"},{"id":90,"slug":"ielts-writing","name":"IELTS Writing","post_name":"IELTS Writing News"},{"id":91,"slug":"ielts-listening","name":"IELTS Listening","post_name":"IELTS Listening News"},{"id":79,"slug":"ielts-writing-part-1","name":"IELTS Writing Part 1","post_name":"News For IELTS Writing Part 1"},{"id":69,"slug":"ielts-listening-part-2","name":"IELTS Listening Part 2","post_name":"News For IELTS Listening Part 2"},{"id":80,"slug":"ielts-writing-part-2","name":"IELTS Writing Part 2","post_name":"News For IELTS Writing Part 2"},{"id":92,"slug":"ielts-writing-graphs","name":"IELTS Writing Graphs","post_name":"News For IELTS Writing Graphs"},{"id":93,"slug":"ielts-academic-writing","name":"IELTS Academic Writing","post_name":"News For IELTS Academic Writing"}]
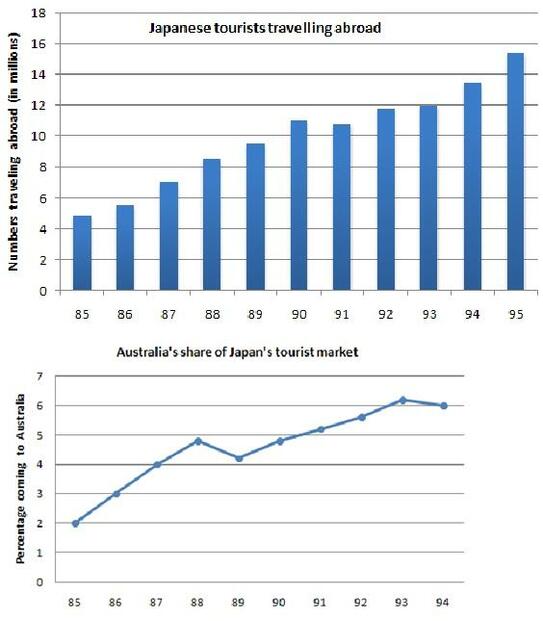
The bar graph illustrates the number in millions of Japanese travelling overseas over a period of 10 years between 1985 and 1995 , while the line graph gives information about the proportion of Australians toward Japanese' tourist market.
Overall , The first graph shows the Japanese tourists who increased in number over a decade , whereas the second graph also showed an upward trend in the distribution of Australian in Japanese travelers.
On the first chart, just above 4 million of Japanese traveled in other country in 1985 and rose to nearly above 11 million after 5 years. Then it slightly declined into million in 1991 , after a year it increased by 2 million in 1992 and remained steady for 2 years , lastly the Japanese tourist suddenly grew in number and hit the highest point at about million in 1995.
For the line chart , the percentage of the distribution of Australian into Japan's market increased steadily and stood at almost 5 % after 4 years beginning at 1985 , then gently plummeted after a year by 1%. From 1989 up to 1993 , It significantly rose again and peaked at year in 1993 at about 6.2% of Australian's share, it gradually decreased minimally at 6% 2 years later.